 Skip to content
Table Of Content
Understanding GTmetrix Reports for Speed Analysis
1. QuickRead
There are a lot of options you have to audit your site speed. In this blog you will see how GTMetrix helps to audit your site performance. GT Metrix is one of the free tools to audit your site speed.
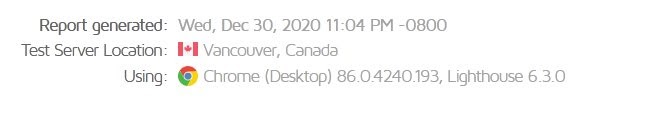
The basic version of GTmetrix is completely free and you can access a number of options simply by signing up for an account. The first is the ability to choose the location in which you want to test your URL. The physical location you choose is very important as it relates to where your website is actually hosted. The available locations include:
- Dallas, USA
- Hong Kong, China
- London, UK
- Mumbai, India
- Sydney, Australia
- São Paulo, Brazil
- Vancouver, Canada
2. What is GTmetrix?
GTmetrix is one of the most popular tools for analyzing site speed performance. It is very easy to use, you can just enter your website URL, it will provide a performance score report which states some suggestions to improve site speed.
Google has introduced a standardized set of web performance and user experience metrics called Web Vitals. Web Vitals consists of various metrics, some important metrics are : Largest Contentful Paint (LCP), Total Blocking Time (TBT), and Cumulative Layout Shift (CLS).
Largest Contentful Paint (LCP)
LCP measures how long the page takes to load from a user perspective. Generally it refers to the time to take the load with the largest image or text block visible to the user. As per google standard LCP should load within 1.5 seconds, if it takes more than that then definitely you should workout to improve the LCP.
LCP is decided by factors such as the render time and the largest video, image, and text in the user’s visible area of a web page. Google looks at this metric to find out how long it takes for the largest piece of content to load, regardless of the size of the device or the type of content on the page. LCP can be impacted by your CSS, your server time, and client-side rendering.
LCP of Less than or equal to 2.5 seconds is regarded as fast. Between 2.6 seconds to 4.0 seconds needs optimization. Greater than 4.0 seconds are considered slow.
You Might Be Interested In: Magento 2 Speed Optimization Services
Total Blocking Time (TBT)
Total Blocking Time is the amount of time a page is blocked before a user can interact with it. Render-blocking CSS and JS can have a huge impact on TBT.
Cumulative Layout Shift (CLS)
CLS measures the visual stability of a webpage. Does the page shift as you scroll, do you go to click a link for it to move before you’ve clicked it. This usually happens because things are still loading in the background. Visual stability is a frustration for users as it can cause confusion – or worse – incorrect use of the site, form, or application. CLS is a score between 0 and 1 based on the element’s moving distance and visual impact in the viewport. A score of 0.1 or less is good, and anything over 0.25 is considered poor.
3. Factors to Consider While Conducting a GTmetrix Speed Test
Some factors are must to consider during site audit in GTmetrix. These factors help to generate accurate audit reports of your site performance.
1. Test Locations
The location of your speed test plays a big role in how fast your site will and how well it will perform.It is recommended to pick a location that’s near your actual target visitors, and the physical location of your website server. If your target visitors come from one location, then ideally that is the location you need to test your website from.
2. Devices to Test
Generally we observed a lot of people only test their site for desktop devices and not for mobile. It’s very important to test website speed for mobile too because as per search engine results 50% internet traffic from mobile users. So it’s a very important mobile speed test in consideration while auditing your website speed.
3. Target Site Pages
During site audit in GTmetrix we recommend to test home page and product pages. Simply testing the homepage of your website will not fully reflect your site’s performance. It’s essential to leverage comprehensive automation testing services to ensure every aspect functions seamlessly. There might be a possibility your homepage contains less amount of heavy code scripts as compared to other pages.
As per analytics Product pages contain more traffic, which means loading speed of product pages are important. So it’s recommended to audit the home page as well as product detail pages.
4. Number of Tests
The last important factor in a GTmetrix speed test is the number of tests you should conduct so that your test result is closer to the reality. It’s not enough to do a one-time test since the results might change based on the amount of traffic. Try repeating the test at different times.
GTmetrix report stats:
- GTmetrix Performance – 85%
- GTmetrix Structure – 83%
- LCP – 1.0s
- TBT – 0ms
- CLS – 0
4. Understanding the Advanced Analysis Option
Summary
GTmetrix generates a performance report which includes various performance measures which includes your “GTmetrix Grade” and “Web Vitals”. The GTmetrix Grade is calculated from two metrics – Performance and Structure. GTmetrix Performance is the performance score from the Lighthouse site audit tool.
GTmetrix Structure is a proprietary performance metric that measures the overall performance of a page.
- GTmetrix Grade – B
- GTmetrix Performance – 85%
- GTmetrix Structure – 93%
- LCP – 1.5s
- TBT – 49ms
- CLS -0.57
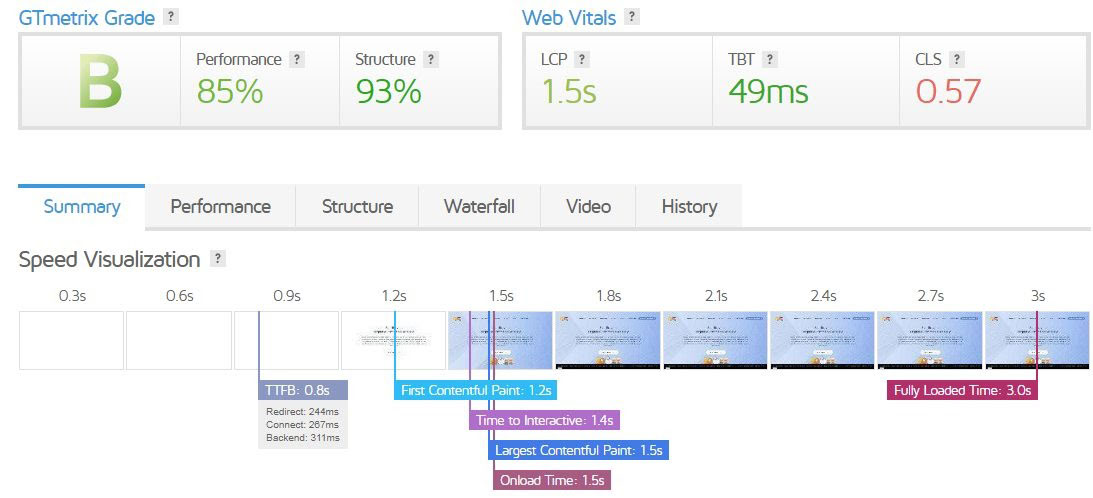
GTmetrix
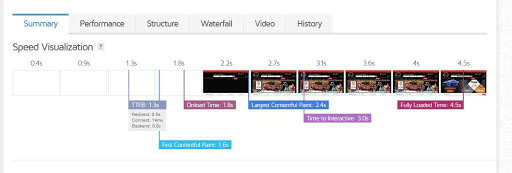
In the above screenshot, you can see GTmetrix summary page also contains a speed visualization, which shows a timeline of key events during a page load. It includes :
- TTFB
- FCP
- Time to interactive
- Large contentful paint
- Fully loaded time
- Onload time
Performance
Performance tab shows the number of useful metrics sourced from performance data. It shows the LCP, TBT and CLS, Speed index, time to interactive, FCP as shown in below screenshots.
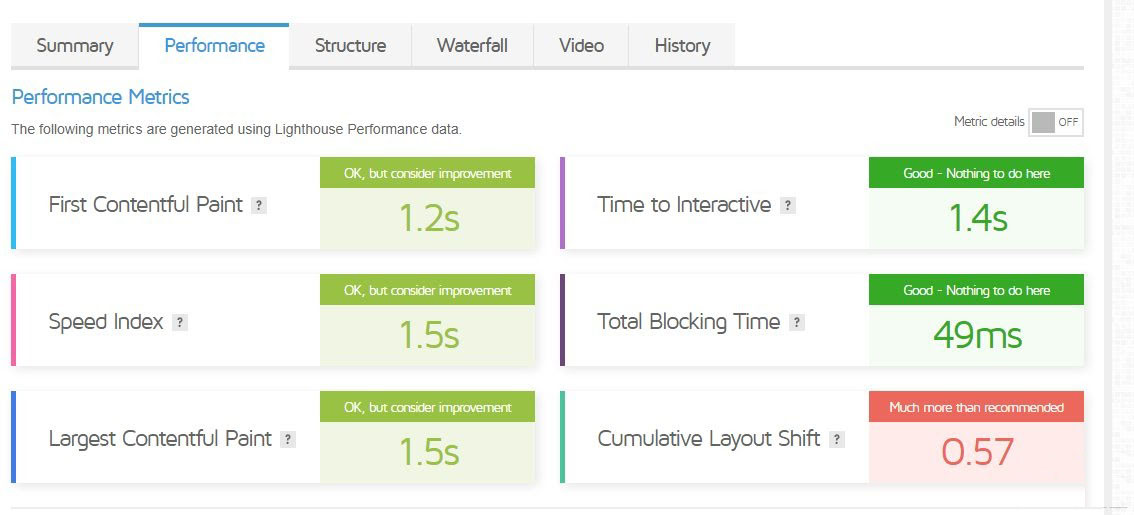
GTmetrics also shows a ‘Browser Timing’ which includes onload time, time to First Byte, Fully loaded time, DOM interactive time, Backend duration and more.
Structure
GTmetrix ‘Structure’ tab provides you with actionable information like ‘reduce initial server response time’, ‘eliminate render blocking‘ and more. Structure audits helps to address them and can serve as a good starting point to improve page load times.
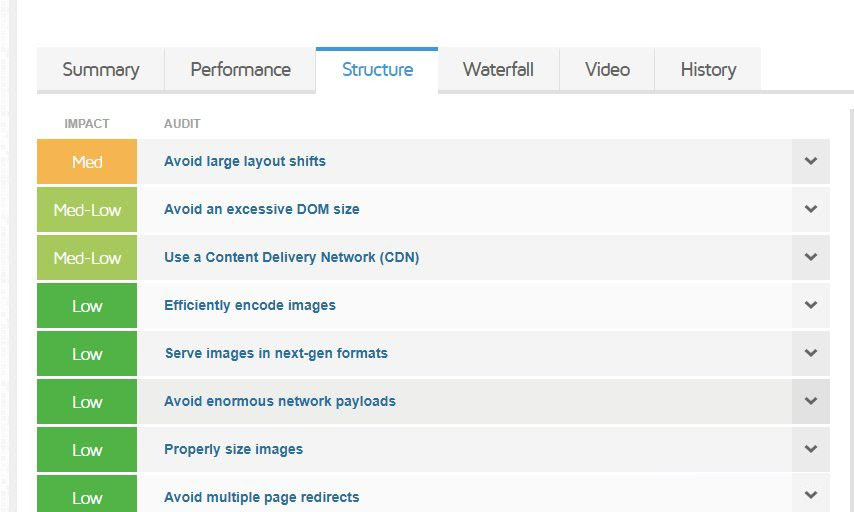
Warnings to be displayed by fixing that you can improve the site performance.
Image Optimization
Images are the selling factor of products in any online store. If images are clear & attractive then customers are always interested in buying products from your site.
Sometimes we see use of heavy size images on site, it is harmful for your site it slows the website speed. Higher resolution images have larger file sizes and that can negatively impact the site speed. Generally it takes time to load the speed on mobile devices. One of the effective ways to increase Magento 2 speed is by compressing all the prevailing images.
Using the below steps you can optimize images.
Serve scaled images
Scaled images useful to resize images and display size as close as possible to original size of the image. It is necessary to pay attention to image sizes and use perfect size images on your website.
For example, your website banner size is 1440 x 400 pixel and during display on the website the image size is using 2000 x 900 pixel. As a result, the browser has to download and scale the picture down before displaying it to the visitors. This process can slow down your website loading time.
However, this issue will not happen if you use scaled images. Smaller images use less space and speed up your site, which in return will improve your site’s SEO and ranking.
Waterfall
The Waterfall chart gives you a deeper insight by exposing the exact bottlenecks in your website’s loading speed. However, this chart might be slightly tough for beginners to understand.
In simple terms, every asset that your web page consists of is essentially an HTTP request made to your site server. By assets I mean the content, image files, CSS stylesheet, HTML script, etc.
There are a series of steps involved in loading each and every asset on your website. Each bar on the Waterfall graph displays each step involved in loading an asset, and the amount of time that step took.
The Waterfall chart is perhaps the most technical aspect of your GTmetrix speed test. But thankfully, GTmetrix provides a comprehensive guide on how to properly read the Waterfall chart. You can find this guide in the Waterfall graph section itself.
Conclusion
GTmetrix is a tool that will help you test your site’s speed performance. Very simple tool to audit your website and apply fixes as per opportunities given in the audit report. If you need any assistance during site audit in GTmetrix then feel free to Contact Us.
Our Blogs


