 Skip to content
Tools to Test your Magento 2 Site Speed
1. QuickRead
Magento 2 page speed is the initial factor affecting user experience, conversion, sales, etc. A slow site causes low conversion, low sales, a second’s delay in the page loading time can increase the chance of losing the customers. A faster website results in a low bounce rate and a higher conversions rate including Mobile user and web user for better customer experience. Before customers get a bad experience on your website you should first audit the website current speed in speed test tool and then improve the site speed.
Might be you thinking how I can check or audit my website to get an exact report where I can improve to achieve a better speed.
No worries….in this blog we will discuss different tools to audit your website speed.
2. Why does Magento 2 speed optimization matter?
Page speed directly impacts user experience, sales and conversion. If customers are getting slow response from your website then they will leave your site page and prefer purchase from competitor website. If you want to offer a good customer experience, better conversion, high seo ranking then we recommend to give importance for speed optimization.
3. Tools to Test your Magento 2(eCommerce) site speed
Below tools you can use to audit your site speed. These tools will provide a detailed report where you can be done for improvement for the site speed.
- GTmetrix
- Pingdom
- Google – PageSpeed Insight
- Web Page Test
Let’s see in detail about each tool.

GTmetrix is a simple online tool that can be used to test website load time. You can enter your site url and click on Test your site, it will analyse the site and show you report. GTmetrix offers details on which aspects your site is taking more time to load and provides a detailed report with the recommendation. By referring to the recommendation report you can work out and apply fixes.
As soon as the page is scanned by the tool, you will get a summary of key performance indicators and website monitoring. Furthermore, this powerful web speed test tool also includes more useful functions:
- Keep track of page performance with monitoring, graphs, and alerts
- Test pages from different regions
- Analyze pages on an actual Android device
- Playback page loads with videos
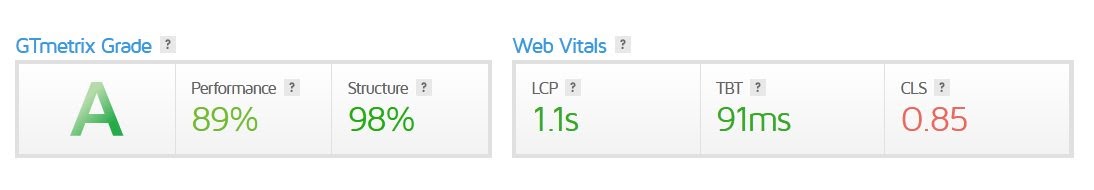
Gtmetrix audit report will focus on Core Web Vitals. As per google update these web vitals are very important to rank the site in google. So you have to understand that and improve. You can refer to our blog for more information about core web vitals and why it is important?
As per GTMetrix report there are three core web vitals.
- Large Contentful Paint(LCP)
- First Input Delay (FID)
- Cumulative Layout Shift (CLS)
The three Core Web Vitals are:
3.1 Largest Contentful Paint
LCP measures how long the page takes to load from a user perspective. Generally it refers to the time to take the load with the largest image or text block visible to the user. As per google standard LCP should load within 1.5 seconds, if it takes more than that then definitely you should workout to improve the LCP.
LCP is decided by factors such as the render time and the largest video, image, and text in the user’s visible area of a web page. Google looks at this metric to find out how long it takes for the largest piece of content to load, regardless of the size of the device or the type of content on the page. LCP can be impacted by your CSS, your server time, and client-side rendering.
LCP of: As per above image, LCP of Less than or equal to 2.5 seconds is regarded as fast. Between 2.6 seconds to 4.0 seconds needs optimization. Greater than 4.0 seconds are considered slow.
3.2 First Input Delay
First Input Delay measures how responsive your website is, once a user clicks on a link, taps a button or any other interaction with the page. What is the delay between the interaction and the result of the website actually doing something. Anything less than 100ms is considered good, anything over 300ms is poor and should be addressed with priority.
3.3 Cumulative Layout Shift
CLS measures the visual stability of a webpage. Does the page shift as you scroll, do you go to click a link for it to move before you’ve clicked it. This usually happens because things are still loading in the background. Visual stability is a frustration for users as it can cause confusion – or worse – incorrect use of the site, form, or application. CLS is a score between 0 and 1 based on the element’s moving distance and visual impact in the viewport. A score of 0.1 or less is good, and anything over 0.25 is considered poor.
LCP of: As per above image, LCP of Less than or equal to 2.5 seconds is regarded as fast.Between 2.6 seconds to 4.0 seconds needs optimization. Greater than 4.0 seconds are considered slow.
You Might Be Interested In: Magento 2 Speed Optimization Services
GTmetrix
Pingdom
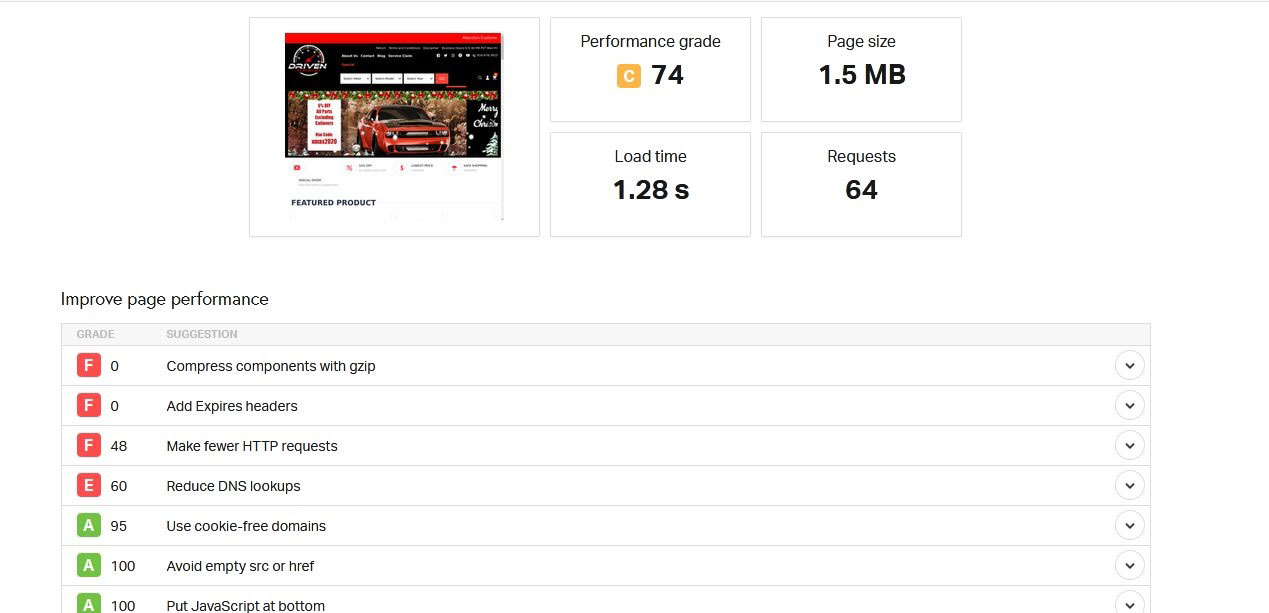
Pingdom is another tool to analyze the site’s speed. You just have to enter your website URL and select the closest region to obtain the most relevant result. The reports on Pingdom include a performance grade, page size, load time and requests.
All you need to get started is to enter the URL of your eCommerce website, select a Test area and start the test. The Pingdom tool allows you to test your website’s speed from seven different locations around the globe. Pingdom tools also suggest a recommendation where you can improve the speed of your website. It will provide a clear picture where the site is slow down. Which resources are taking more time to download? Images optimized or not if there is scope of image optimization it will suggest in report how you can save.

Google – PageSpeed Insight
Google PageSpeed Insights is a free tool by Google to help you evaluate the performance of your website. The tool gives scoring for both Mobile and Desktop; and provides suggestions on how to improve the speed of the website page.
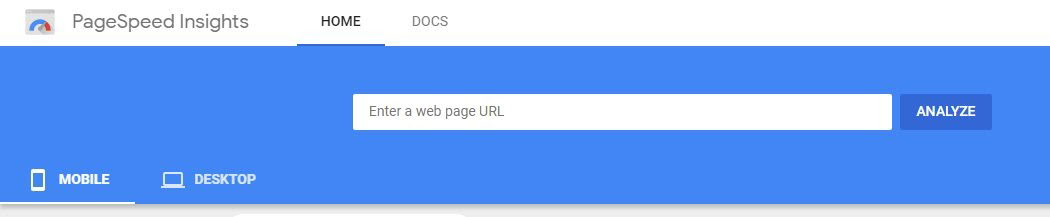
Enter the URL of your Magento eCommerce website and click on Analyze, Google will analyse it and provide a recommendation report including both Lab data and real world data. The score provided summarizes the page’s performance – score of 90 or above is considered fast, 50 to 90 is considered average and below 50 is considered to be slow. PageSpeed Insights audit provides recommendations of optimizations that can be done on the page to improve the speed.
Important Metrics of PageSpeed Insights
When you analyze your Magento 2 website on Google’s PageSpeed Insights you’ll see different results for mobile and desktop versions of your site. These results illustrate Field Data along with Origin Summary and Lab Data.
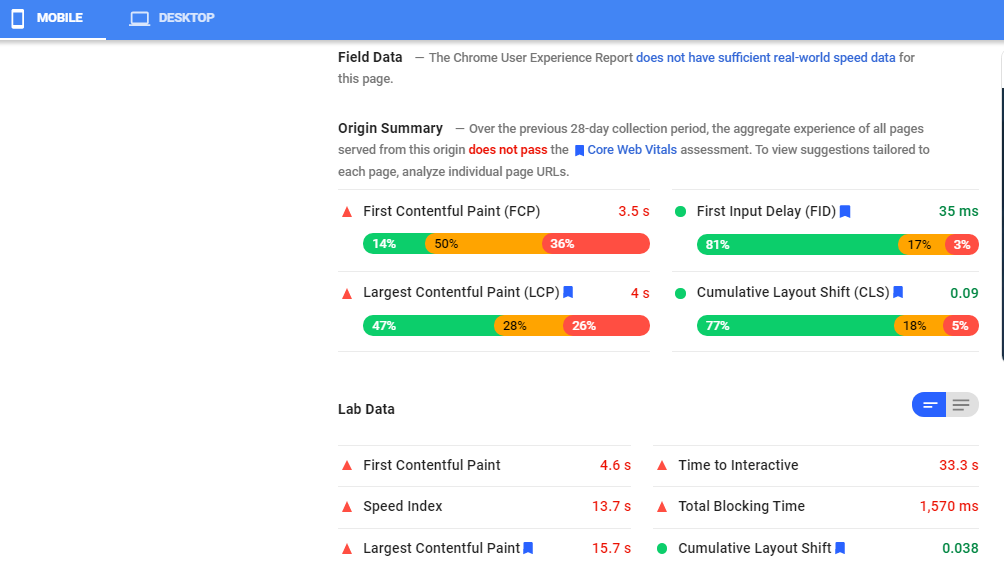
These data helps you to understand that your website is either performing good, poor or needs improvements, based on certain criteria.
Let’s see meaning of these 6 metrics,
First Contentful Paint:
The First Contentful Paint (FCP) metric measures the time from when the page starts loading to when any part of the page’s content is rendered on the screen. For this metric, “content” refers to text, images (including background images).To provide a good user experience, sites should strive to have First Contentful Paint occur within 1 second of the page starting to load.
First Meaningful Paint:
Measures when the primary content of a page is visible.
Speed Index:
shows how quickly the contents of a page are visibly populated.
Time to Interactive:
the amount of time it takes for the page to become fully interactive.
Largest Contentful Paint :
The Largest Contentful Paint (LCP) metric reports the render time of the largest image or text block visible within the viewport. To provide a good user experience, sites should strive to have Largest Contentful Paint occur within the first 1.5 seconds of the page starting to load.
First Input Delay:
FID measures the time from when a user first interacts with a page (i.e. when they click a link, tap on a button when the browser is actually able to begin processing event handlers in response to that interaction.
Web Page Test
WebPage test is another tool where you can check your site performance. Using this tool you can run the website speed and test from multiple locations around the globe using real browsers (IE and Chrome) and at real consumer connection speeds.
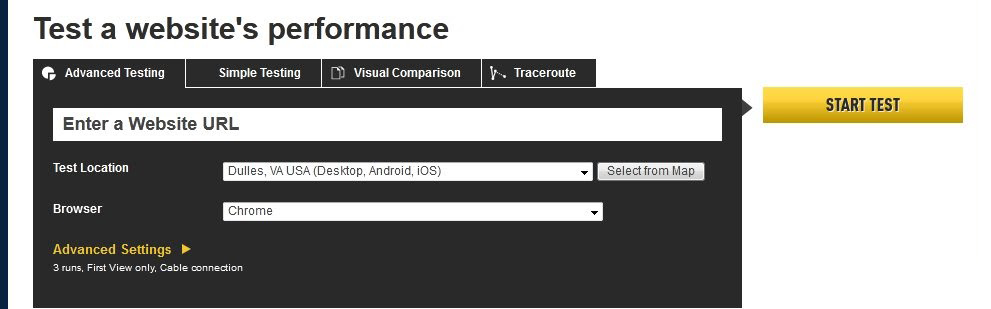
You can run simple tests or perform advanced testing including multi-step transactions, video capture, content blocking and much more. Your results will provide rich diagnostic information including resource loading waterfall charts, Page Speed optimization checks and suggestions for improvements.
4. Conclusion
Your site speed is the most important factor for the better user experience and you need to ensure that your website does not load slowly.
Using these tools you can audit your site speed and improve the scores as per recommendation report. If any query related to this blog then please Contact Us for more information and services.
Our Blogs


