 Skip to content
Understanding the Google PageSpeed Insights and applying for Magento 2 site to improve score
1. Quickread
Most of the time we hear about the Google Page Speed Insight score being very bad. Yes, it’s very very true. It can be easy to get a high score in gtmetrix but when you come at a GPI score then there is really a problem with the score. As we know the significance of page load time, it’s very crucial to have a better website speed to rank higher in google ranking higher on search engine result pages (SERPs).
Once you audit your website in google page speed, it recommends a number of opportunities to fix. To get the best score you should invest a bit of your time into analyzing, fixing, and debugging every Google Page speed opportunity and our guide is here to help. We need to understand why 100/100 performance score matters in PageSpeed Insights (PSI). Is it worth the effort and time? Don’t worry. In this article, we will cover all of these along with possible fixes of each issue found on PageSpeed Insight. So, you should use the PSI tool to find real problems and opportunities where you can improve. Optimizing your website for those listed opportunities will help improve your actual as well perceived loading time. Let’s see in details:
It’s very important to audit your site on Google PageSpeed Insights and focus on the mobile-first experience, because mobile purchases are on the rise. Google values mobile user experience higher than desktop. it’s harder to optimize for slower mobile networks and smaller devices. But when you do that, your desktop score will also rise.
2. Important Metrics of PageSpeed Insights
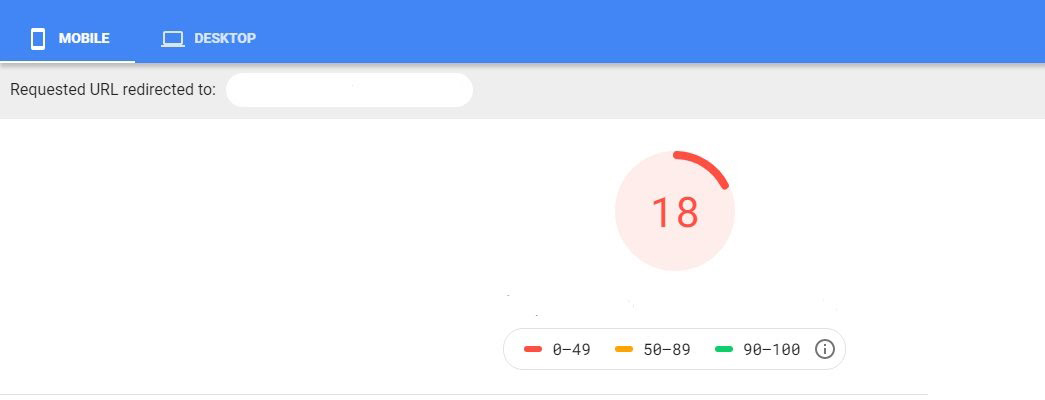
When you analyze your Magento 2 website on Google’s PageSpeed Insights you’ll see different results for mobile and desktop versions of your site. These results illustrate Field Data along with Origin Summary and Lab Data.
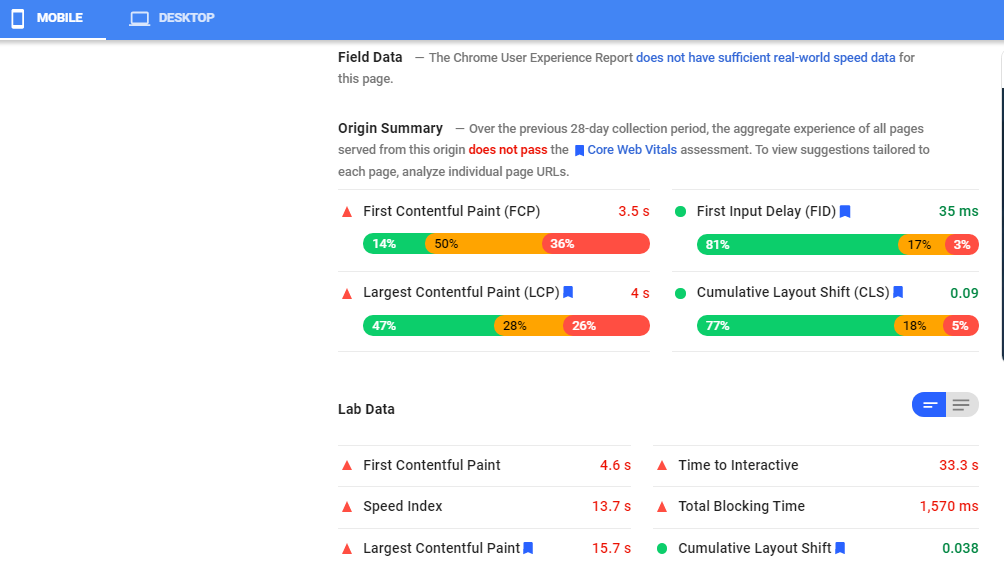
When you analyze your Magento 2 website on Google’s PageSpeed Insights you’ll see different results for mobile and desktop versions of your site. These results illustrate Field Data along with Origin Summary and Lab Data.
These data helps you to understand that your website is either performing good, poor or needs improvements, based on certain criteria.
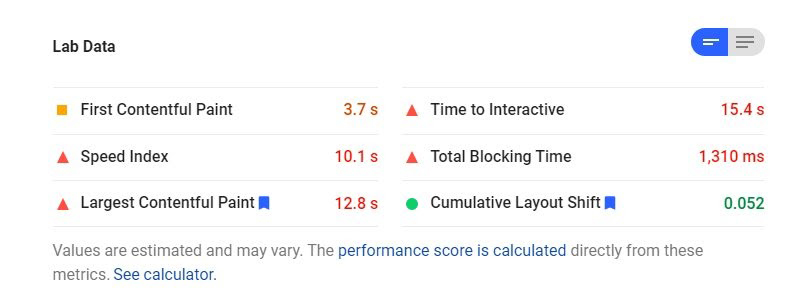
Let’s see meaning of these 6 metrics,
First Contentful Paint
The First Contentful Paint (FCP) metric measures the time from when the page starts loading to when any part of the page’s content is rendered on the screen. For this metric, “content” refers to text, images (including background images).To provide a good user experience, sites should strive to have First Contentful Paint occur within 1 second of the page starting to load.
First Meaningful Paint: Measures when the primary content of a page is visible.
Speed Index: shows how quickly the contents of a page are visibly populated.
Time to Interactive: the amount of time it takes for the page to become fully interactive.
Largest Contentful Paint : The Largest Contentful Paint (LCP) metric reports the render time of the largest image or text block visible within the viewport. To provide a good user experience, sites should strive to have Largest Contentful Paint occur within the first 1.5 seconds of the page starting to load.
First Input Delay: FID measures the time from when a user first interacts with a page (i.e. when they click a link, tap on a button when the browser is actually able to begin processing event handlers in response to that interaction.
3. Opportunities Found by PageSpeed Insights for Magento
Google pagespeed audits help by providing the opportunities in detail. By fixing those you can improve the Magento site speed. Each audit will improve one or more Lab Data metrics. Lets see one by one:
1. Defer Offscreen Images
This opportunity can be fixed by using lazy loading. Lazy loading slows down offscreen images loading. Users can’t see offscreen images when they enter the store, they just see a few banners at the top and probably some content on the visible screen.
When a user opens a webpage, all the contents of the page are downloaded, including all images in it. Obviously, if the web page contains more images, then it will take more time to load. Lazy loading is a handy skill to help you prevent downloading of unnecessary images. Instead of loading all images at one time, the images are loaded only when the user accesses the part of the page that relates to these images. With lazy loading, on-screen images are loaded first, and the remaining images are gradually loaded as and when the user scrolls through the page. For Example, if your web page contains 100 or more images then instead of loading all the images at one time we can add images in lazy loading and load only required images on page scrolling.
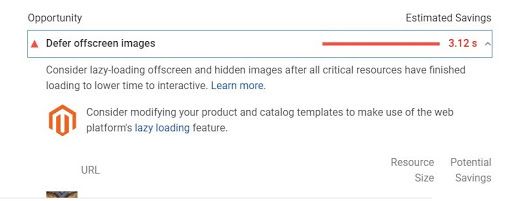
Lazy loading usually refers to images, it’s possible to use it to reprioritize the load order of JS scripts, CSS, and HTML files, too. Offscreen image deference has a major impact on Time to Interactive (TTI).
You Might Be Interested In: Magento 2 Speed Optimization Services
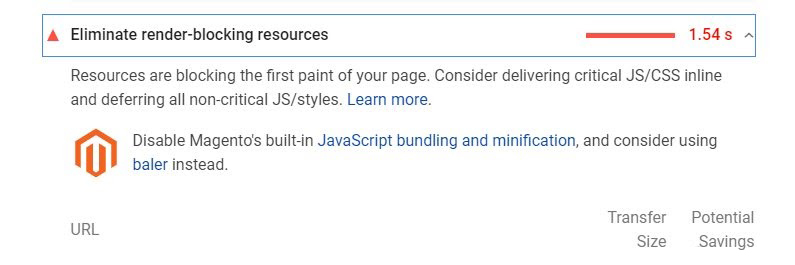
You can eliminate render blocking by moving critical code out of head. In most of the cases it has been found that js and css are included in Head code. If there is no defer associated with these includes then that code will block rendering.
This should be avoided if “defer” was not needed or reduced to the highest possible extent. Also on times there are Java script lines embedded in head this again will do the render blocking if these are getting executed.
4. Reduce Initial Server Response Time
Once a user requests a browser, the browser requests a server to fetch the requested content by the user. If your site contains more http requests then it will take a long time to respond to users request and user dislike when pages take a long time to load.
There might be a number of reasons to slow down server initial response. VARnish caching system is the best solution to improve server response time on your Magento 2 site. When you are using the varnish cache server, you can ensure that the requests are received very fast rather than a web server. There are lots of benefits using Varnish cache, it reduces the load of the backend, as it delivers the content from the cache server.
Another reason to slowdown your website is the server. If your server is slow then it will impact the initial response time. So optimize the server application logic to faster the website. optimize server queries database, upgrade your server hardware.
5. Remove unused JavaScript
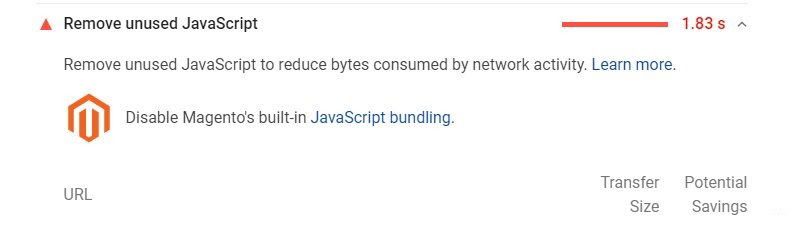
Sometimes your online website contains unused javascript files. Unused Javascript can slow down your website, because browsers don’t know which is useful or not, so the browser will download, parse, compile and evaluate all the JS before it can proceed with all of the other work that is needed for rendering the page. Recommended to keep minimum js inside the head, instead we can use the javascript asynchronous so that js can be loaded parallel and reduce the load time.
So there is a must to remove the unwanted JS.
6. Remove unused CSS
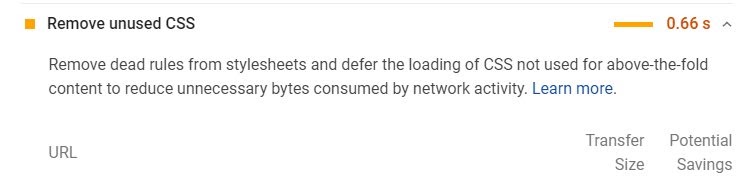
By default, a browser must download, parse, and process all external stylesheets that it encounters before it can display any content to a user’s screen. Each external stylesheet must be downloaded from the network. These extra network trips can significantly increase the time that users must wait before they see any content on their screens. If unused css is there then it will increase load time. You basically need to separate CSS styles by page type instead of clumping them all together. It’s a little bit hard to do, but once done it will improve in site speed.
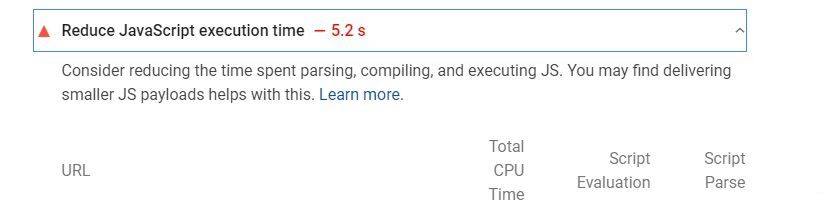
7. Reduce JavaScript Execution Time
The best way to reduce JavaScript execution time is you can remove unwanted js files, minify and compress files. Unused Javascript can slow down your website, because browsers don’t know which is useful or not, so the browser will download, parse, compile and evaluate all the JS before it can proceed with all of the other work that is needed for rendering the page.
8. Ensure Text Remains Visible During Webfont Load
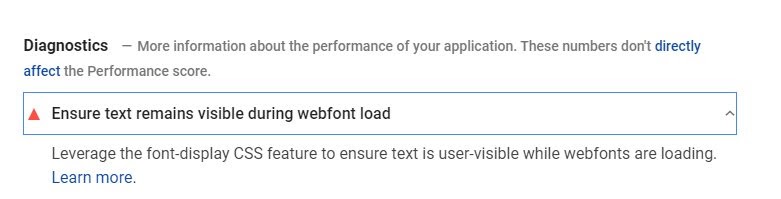
The font-display API specifies how a font is displayed. swap tells the browser that text using the font should be displayed immediately. Turning on the swap in CSS font-display settings can help speed up text rendering. By default, your CSS either doesn’t have any font-display config or uses something like a block which is slower. If the requested custom font is not available then you should use a system font so that it can be used until the requested font is displayed. Once the custom font is ready, it replaces the system font.
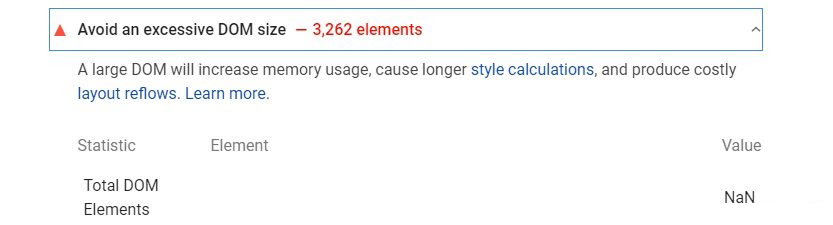
9. Avoid an excessive DOM size
As covered by Google, an excessive DOM can harm your web page performance. It is recommended that your web page have no more than 1500 nodes.
If your web page that uses an excessively large DOM element then browsers will take more time to render. So it should be taken care during use of the DOM element on your website.
Conclusion:
Your site speed is the most important factor in online selling. As google priority to the site when the site is having a good score and minimum load time. So we recommended that you audit your site on google page speed insight test tools and find the report. Our guide will help you to understand what does mean by each opportunity by GPI and how you can apply fixes. If any questions related to this article then feel free to Contact Us.
Our Blogs


