 Skip to content
What is GTmetrix?
Feb 06, 2020 | 05 min read
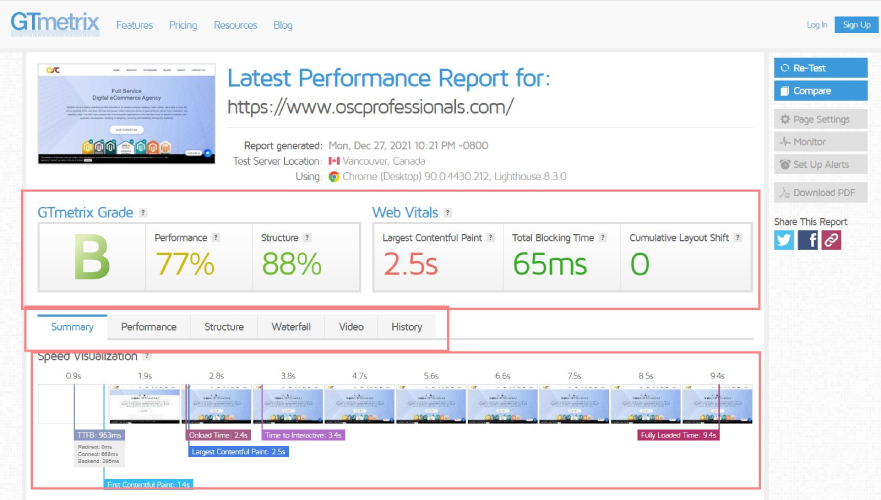
One of the most popular tools for analyzing site speed is GTmetrix. This is a tool that analyzes page speed and performance. GTmetrix is an excellent tool if you need insights and a complete report on your website’s performance and what you can do about it.

How Does GTmetrix Work?
The goal of the tool is to help you boost your site’s speed by giving you better search results and ranking on Google. The idea is to make your site load faster so that it appears more like a page that someone is seeing instead of one that is loading slowly. It has two major components: web speed testing and speed tracking. You can schedule web speed tests to determine how your website performs. You can also track your site’s speed at various points in the day to determine if there is anything you could be doing to speed it up.
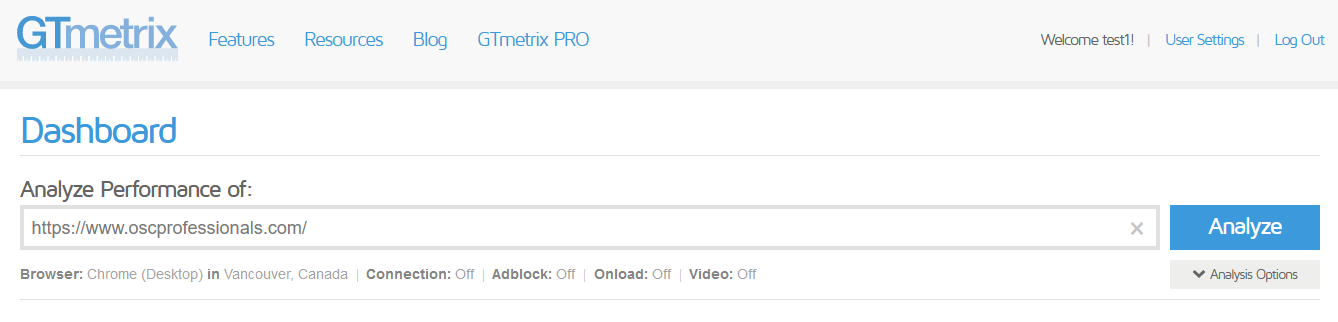
Hit your site and check all the performance
How to Work GTmetric Waterfall Chart?
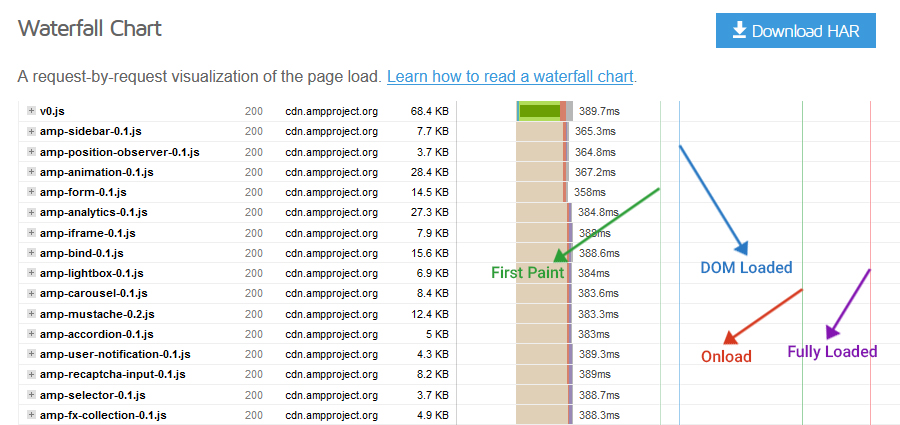
To learn more about your site’s performance, click the third tab and read GTmetrix’s Waterfall chart. The Waterfall Map explains the page’s loading behavior by analyzing each individual request.
An example would be a script, media file, or external tool that is included on the page being tested
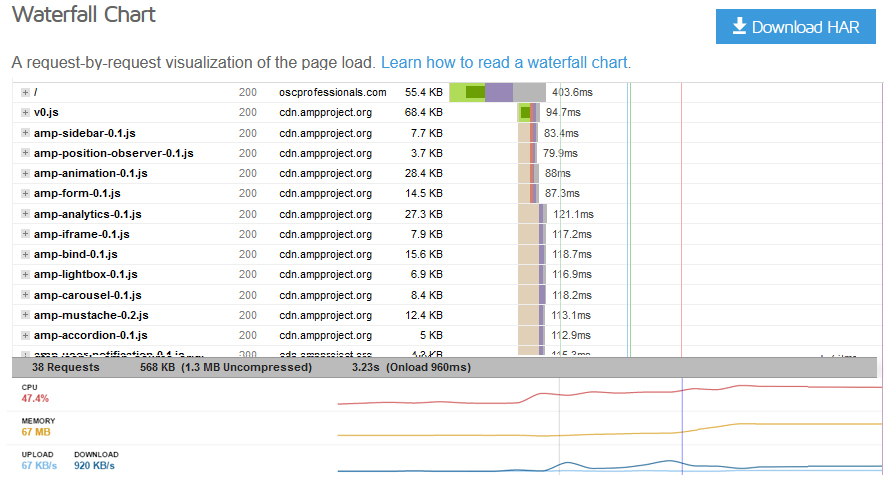
This tab is very useful for getting an idea of what resources your page will load, and in what order.
The GTmetrix Waterfall Chart is composed of five columns, from left to right:
- The requested resource file name.
- HTTP Response Status retrieved from the server for that tool.
- Source file, this is where the resource comes from.
- For each resource, file Size.
- Load Time Breakdown, which represents the time it takes for each resource to download / execute.
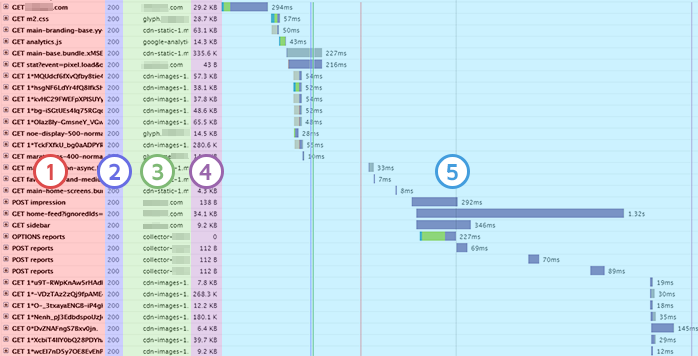
In the case of a selected file, you can read the path if you hover over the name. When you Ctrl+Click on it, you can open it in another tab, so you can better identify it and see what it contains.
How to Measure Load Time Breakdown?
Each resource’s loading process can be differentiated using the color code designed by GTmetrix.You can view the various phases of the loading process by hovering over the load time bar for each resource.
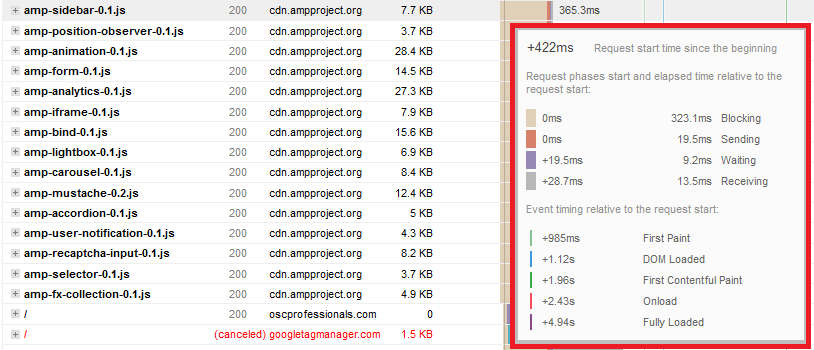
Additionally, GTmetrix shows the relative time of each phase of request execution, which is the time at which certain milestones are reached.
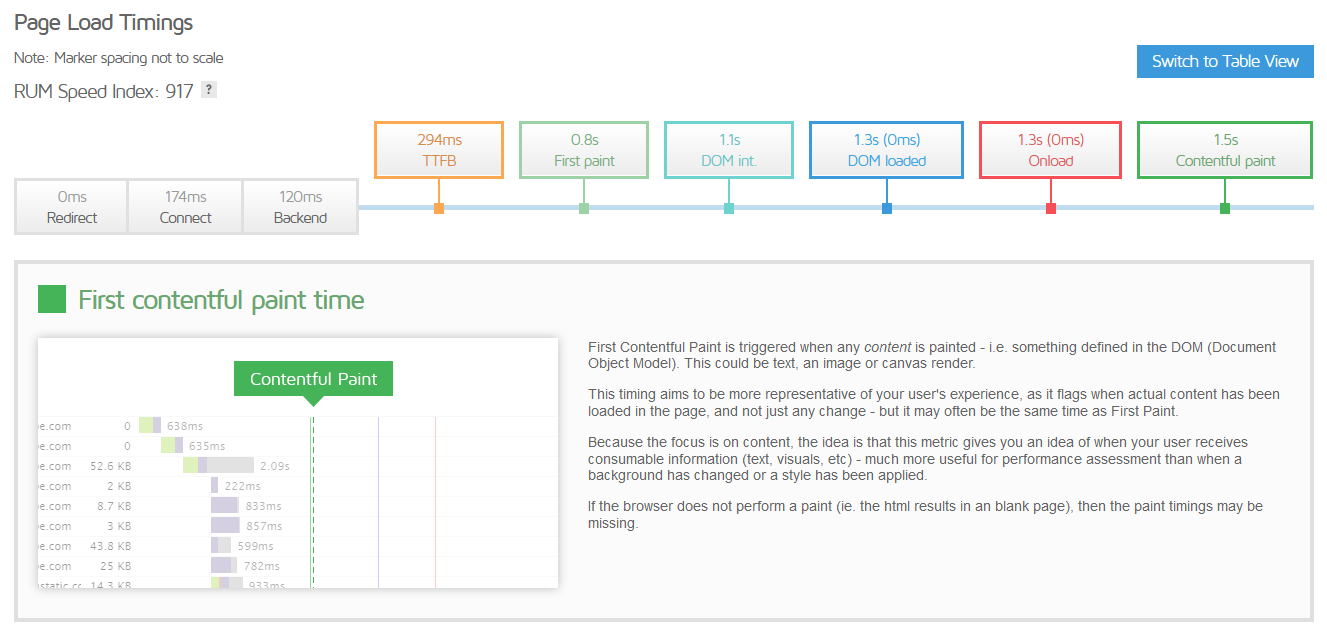
How to Measure Timings tab?
It is very helpful because it explains in a simple and concise manner when page loading is interrupted.
How to use the GTmetrix Speed Optimization Tool for your Shopify store
To create a more efficient and effective speed marketing strategy you’ll first need to understand your best practices and create a plan for optimizing your store. Here are a few things you will want to keep in mind while optimizing your store: Optimize every aspect of your site.
Conclusion
The speed optimization tool that you use can positively affect the lives of thousands of people who visit your store each week. Let’s take a look at what it does, why you should, and how to make the most of it.


