 Skip to content
1. DevTool Chrome Performance Tool
1.1 Identification
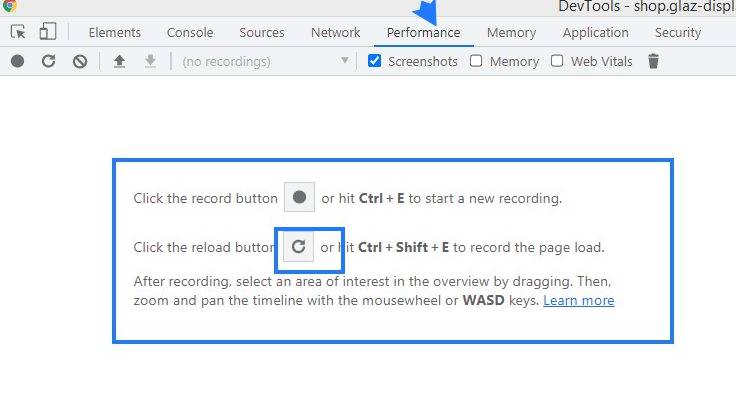
Just right-click and select Inspect. Start by recording runtime performance: Open DevTools and click on the Performance tab.
1.2 All the Filters
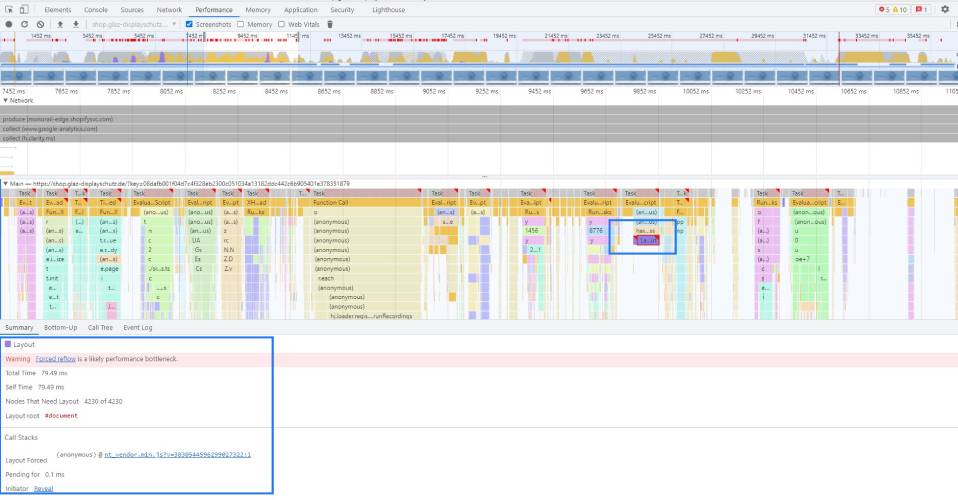
What is a long task and how to find it
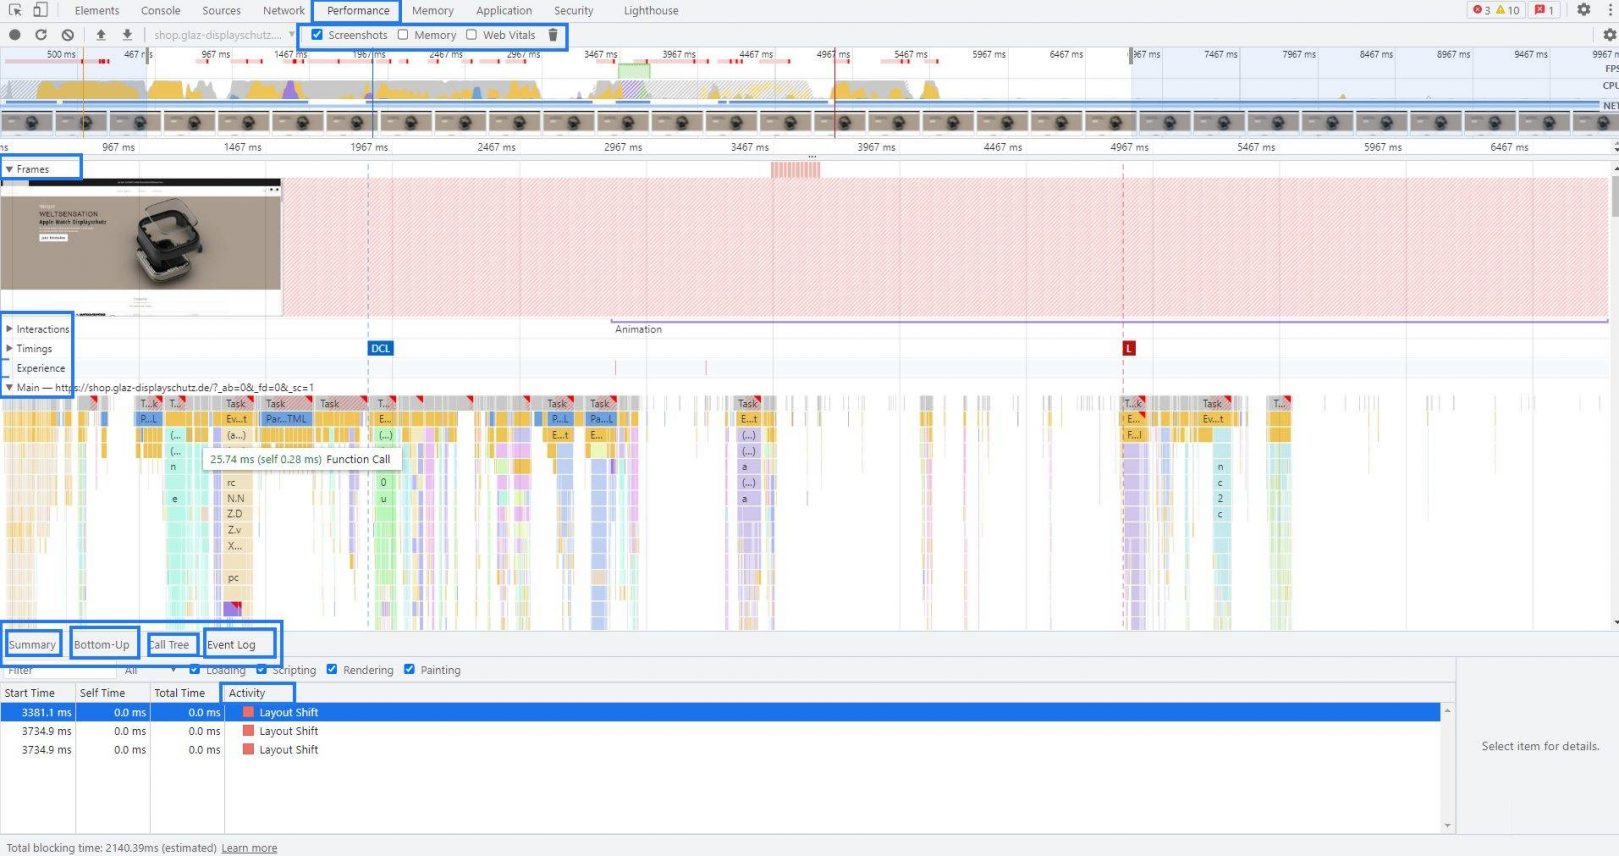
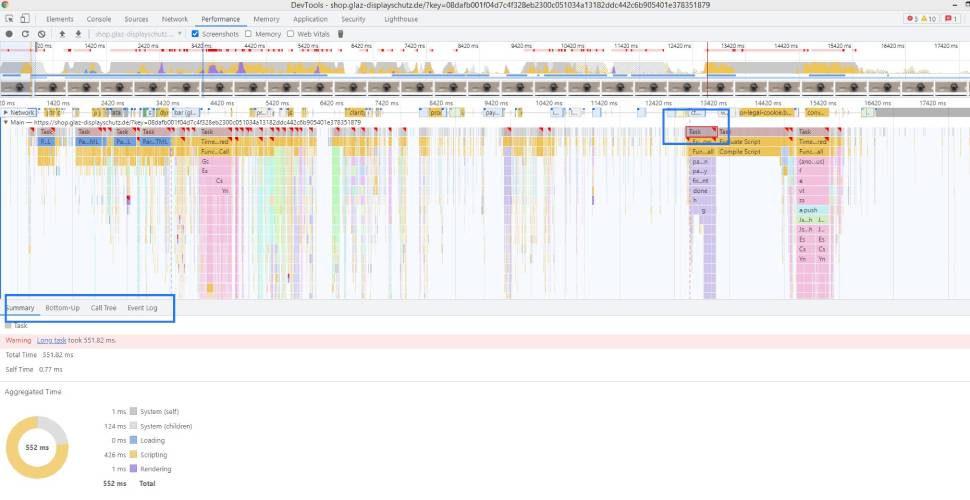
1. Note the summary tab. When no events are selected, this tab shows you a breakdown of activity. The page spent most of its time rendering. Since performance is the art of doing less work, your goal is to reduce the amount of time spent doing rendering work.
2. Expand the Main section. Dev-Tools shows you a flame chart of activity on the main thread, over time. The x-axis represents the recording, over time. Each bar represents an event. A wider bar means that event took longer. The y-axis represents the call stack. When you see events stacked on top of each other, it means the upper events caused the lower events.
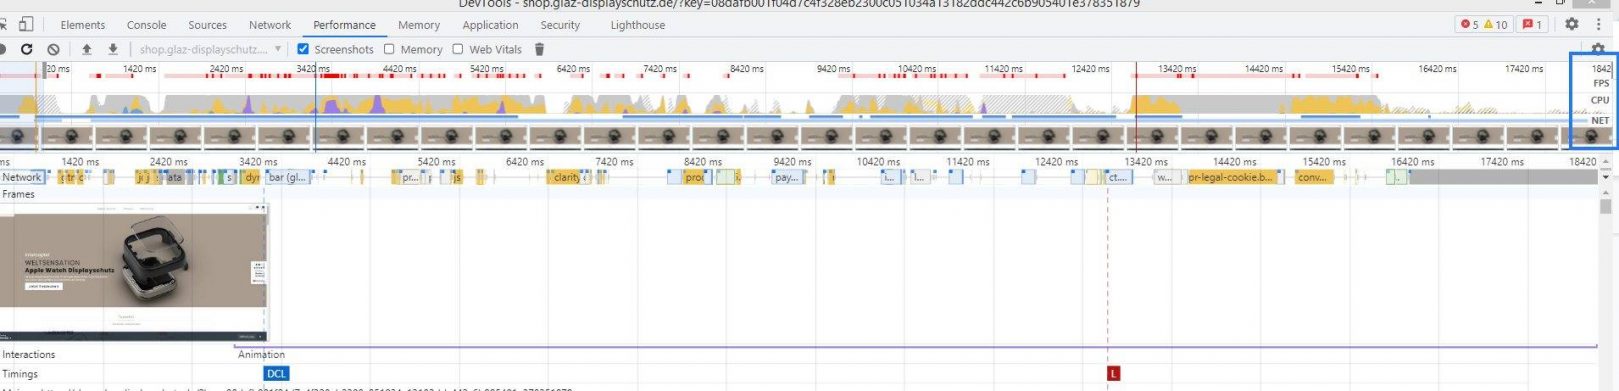
3. There’s a lot of data in the recording. Zoom in on a single Animation Frame Fired event by clicking, holding, and dragging your mouse over the Overview, which is the section that includes the FPS, CPU, and NET charts. The Main section and Summary tab only display information for the selected portion of the recording.
4. Note the red triangle in the top-right of the animation frame fired event.Whenever you see a red triangle it’s a warning that there may be an issue related to this event.
5. Click the Animation Frame Fired event. The Summary tab now shows you information about that event. Note the reveal link. Clicking that causes Dev-Tools to highlight the event that initiated the Animation Frame Fired event. Also note the app.js:94 link. Clicking that jumps you to the relevant line in the source code.
Note: The goal is to respond to input in under 50 ms.
0 to 16 ms:-
Users are exceptionally good at tracking motion, and they dislike it when animations aren’t smooth. They perceive animations as smooth so long as 60 new frames are rendered every second. That’s 16 ms per frame, including the time it takes for the browser to paint the new frame to the screen, leaving an app about 10 ms to produce a frame.
0 to 100 ms
Respond to user actions within this time window and users feel like the result is immediate. Any longer, and the connection between action and reaction is broken.
100 to 1000 ms
Within this window, things feel part of a natural and continuous progression of tasks. For most users on the web, loading pages or changing views represents a task.
1000 ms or more
Beyond 1000 milliseconds (1 second), users lose focus on the task they are performing.
10000 ms or more
Beyond 10000 milliseconds (10 seconds), users are frustrated and are likely to abandon tasks. They may or may not come back later.
Important metrics to measure
- First Contentful Paint (FCP)
- Largest Contentful Paint (LCP)
- First input Delay (FID)
- Time to interactive (TTI)
- Total blocking time (TBT)
- Cumulative layout shift (CLS)
Description about tab
Bottom-Up tab
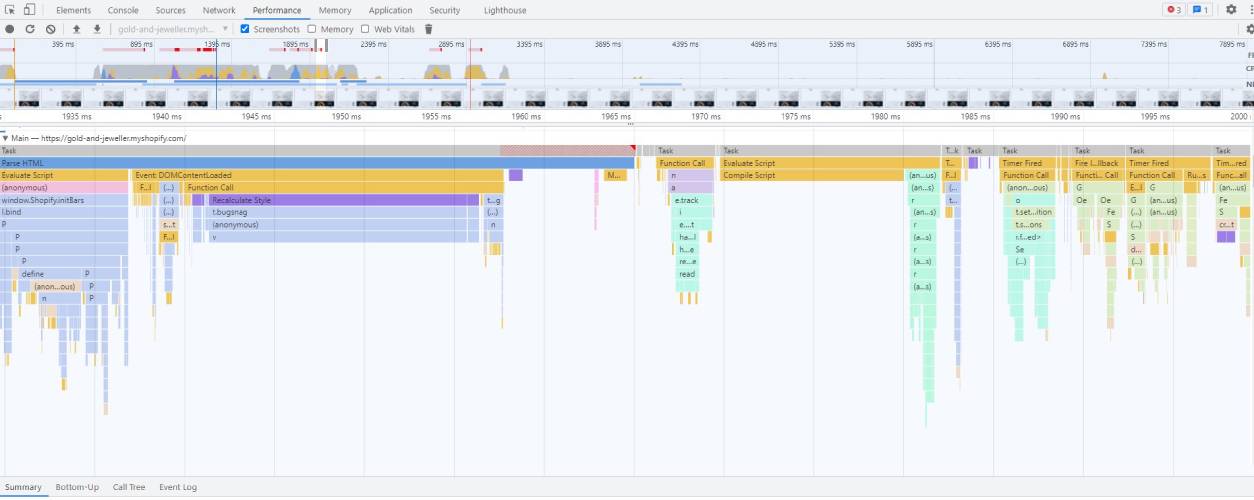
You can select the Bottom-Up view to see a more fine-grained breakdown of CPU activities. It shows the lowest-level types of activities from the bottom of the call tree, so you’ll often see native browser functions like getBBox or setAttribute.
Call Tree tab
The Call Tree tab is similar to the flame chart: it shows you how much time different subtasks and function calls contribute to the overall duration of a task.
The Event Log tab
Use the Event Log tab to view activities in the order in which they occurred during the recording.
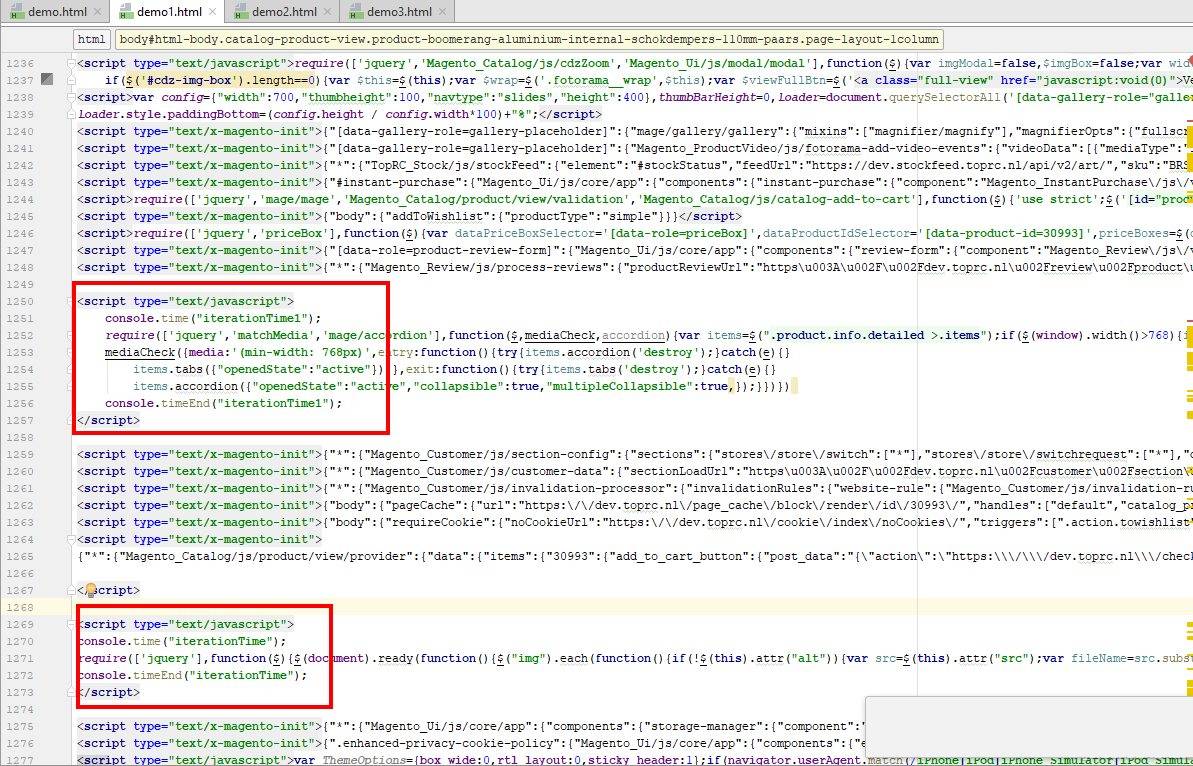
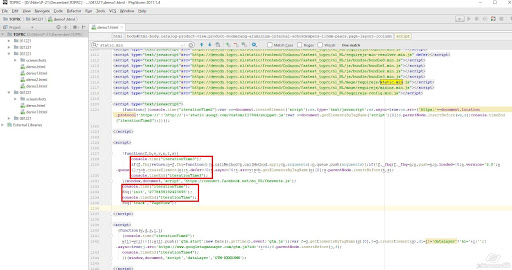
Console.time
Console.time is used to start a timer in order to track the duration of a particular operation. When scheduling the timer, we give the timer a unique name for identification since we can have several timers running concurrently on the same page.
Analysis about working of console.time and use it to check function execution timing.
for instance, that we want to measure the duration of a particular iteration process in our application. We will define a timer that starts the moment that function is called and runs till the end of the iteration process. This scenario we have created can be exemplified like this:
Example:
Web Vitals are a set of useful metrics that aim to capture the user experience of a web page. In the Create React App, a third-party library is used to measure these metrics (web-vitals). To understand more about the object returned to the function when a metric value is calculated, refer to the documentation.
console.time(“iterationTime”);
for (i = 0; i < 10; i++) {
// some code
}
Input
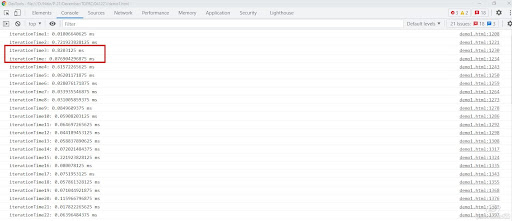
Output
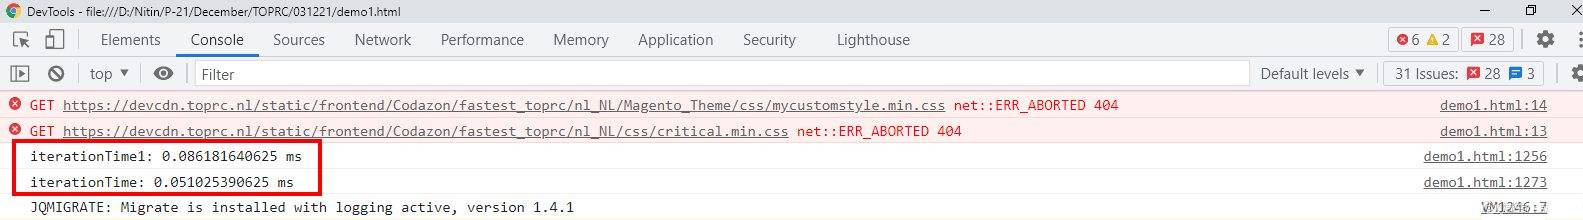
We can use it under the function for testing particular loop or expression execution timing.
Output


